By Robin Singhvi · Founder, SmartCue · Updated April 29, 2026
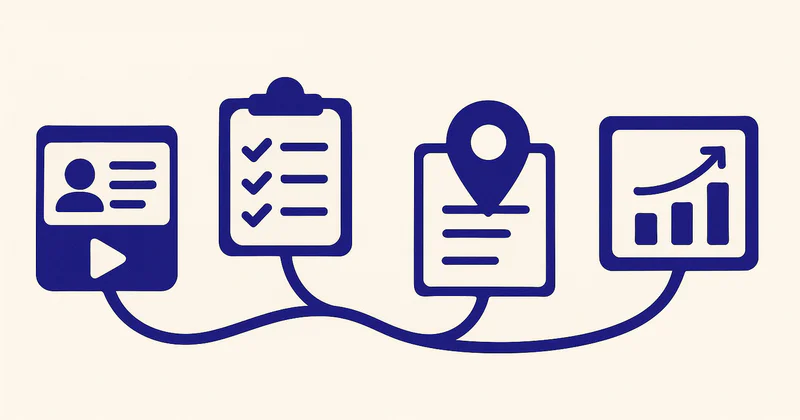
Most teams who say "we have an interactive product experience" mean one thing: a demo on the website. That's a quarter of the job. The other three quarters — onboarding walkthroughs, in-product feature guides, renewal-stage value recaps — are usually missing, half-built, or owned by nobody. The gaps cost retention more than the website demo costs to build.
Here is the thesis I will defend in this post: interactive product experiences are not one thing. They are four distinct artifacts with four different jobs across the customer lifecycle. Pre-purchase demos sell. Post-purchase onboarding ramps. In-product guides drive feature adoption. Renewal-stage walkthroughs justify the spend. Most teams build one of these and call it "interactive product experience" — they should build all four, because each plays a different role and the gaps cost retention.
If you only finish the pre-purchase artifact, you are optimizing the moment you win the customer and ignoring the moments you keep them. That math doesn't work in 2026. Net dollar retention is the metric the board cares about, and three of the four artifacts move it.
I built SmartCue around this four-artifact framing. After watching 4,000+ teams ship roughly 10,000 demos with well over 1.5 million viewer interactions, the pattern is consistent: the customers who ship across the lifecycle compound. The customers who ship one and stop don't.
The four artifacts, defined
Each of the four artifacts has a different job, audience, surface, and success metric. Mixing them up is the most common failure mode I see.
Artifact 1 — Pre-purchase interactive demos
Job: sell. Convert anonymous visitor into evaluator, evaluator into trial, trial into closed-won.
Audience: prospects, often anonymous, often skeptical.
Surface: website hero, /product, /pricing, comparison pages, cold-email follow-up, paid-ad landing pages.
Success metric: demo completion rate, demo-to-trial rate, demo-to-meeting-booked rate.
This is the artifact most teams already have some version of. It is also the artifact that gets the most attention and the most budget.
Artifact 2 — Post-purchase onboarding walkthroughs
Job: ramp. Take the new customer from "signed contract" to "first value moment" without a human-led implementation call eating CSM hours.
Audience: new customers, named, motivated, often confused.
Surface: welcome email, post-signup in-app modal, the first session of the customer portal.
Success metric: time-to-first-value, percentage of customers reaching activation milestones in week 1, deflected onboarding-call hours.
Most teams skip this entirely or replace it with a 60-minute kickoff Zoom that costs them CSM capacity and frustrates the half of customers who would rather self-serve.
Artifact 3 — In-product feature-launch guides
Job: drive feature adoption after launch. Move existing users from "didn't know that existed" to "uses it weekly."
Audience: existing active users, opted-in to the product, often busy.
Surface: in-app modal triggered by login, feature-specific tooltip walkthrough, what's-new email with embedded interactive walkthrough.
Success metric: percent of monthly active users who try the new feature within 30 days of launch, week-2 retention of feature usage.
This is the artifact product teams are supposed to own. In practice it lives in nobody's lane — PMM ships the feature page, engineering ships the feature, nobody ships the user-facing walkthrough.
Artifact 4 — Renewal-stage value-recap walkthroughs
Job: justify the spend. Show the customer what they got from the product over the last twelve months, in their own data, before the renewal conversation starts.
Audience: existing customers, especially the economic buyer who hasn't logged in this quarter.
Surface: quarterly business review embed, renewal-prep email 60 days before contract end, customer-success-led one-pager.
Success metric: gross retention rate, net dollar retention, multi-year contract attach rate.
Almost no team builds this artifact at all. It is the highest-impact one for the second purchase decision the customer makes about you, and it is the one most consistently absent.
Why most teams only build one
The reason for the gap is structural, not strategic. Four artifacts, four owners. Pre-purchase belongs to marketing or PMM. Onboarding belongs to customer success. In-product feature launches belong to product. Renewal recaps belong to CS or account management. Most companies have separate org charts, separate budget lines, and separate tool stacks for each of these functions.
When marketing buys the interactive-demo tool, they buy it for artifact 1. The contract gets justified on website conversion lift. CS doesn't get a seat. Product doesn't get a seat. Account management doesn't get a seat.
Twelve months later, the tool is still doing artifact 1. The other three artifacts are either missing or living in different tools that don't talk to each other. The investment compounds at one-quarter speed.
The fix is not "buy four tools." The fix is to treat interactive product experience as one capability with four output artifacts and one shared platform underneath. That's the framing I want every team to adopt before they renew their interactive-demo contract for year two.
Building artifact 1: pre-purchase interactive demos
The mechanics of building artifact 1 are well-documented. I have a separate walkthrough at How to Create an Interactive Product Demo that goes step by step through the build. Short version for context here:
- Capture the flow with a Chrome extension. About 90 seconds.
- Edit the steps. Reorder, delete strays, add captions, add highlights. About 3-4 minutes for a 12-step demo.
- Publish. Get a share link and an embed snippet.
- Distribute on the surface that fits the funnel stage (homepage hero for top of funnel, pricing-page embed for mid funnel, sales-email follow-up for bottom).
- Measure. Step-level drop-off, completion rate, CTA clicks, lead-gate completions.
Two artifact-1 specific decisions matter most:
Length. Top-of-funnel demos should hit 60-90 seconds and cover one job. Mid-funnel demos earn 3-5 minutes because the viewer has self-selected. Bottom-funnel comparison demos can run longer if they answer "why us not them" head-on.
Gating. Top-of-funnel: never gate. The viewer hasn't earned the value exchange. Mid-funnel: optional gate at step 5-8. Bottom-funnel: gate is fine because the viewer is already qualified.
The artifact-1 mistake I see most often is teams building one universal demo and dropping it everywhere. One demo cannot serve a homepage visitor and a pricing-page visitor and a cold-email recipient. Build three variants of the same source flow.
Building artifact 2: post-purchase onboarding walkthroughs
This is where most teams need to start expanding. Onboarding walkthroughs differ from pre-purchase demos in three ways.
The viewer is named. No anonymous traffic. The customer signed a contract. You know their name, company, role, and probably their use case from the sales handoff notes. Personalize accordingly.
The job is product, not pitch. The viewer is past "should I buy this." The walkthrough must show them how to use the thing they already bought. That means deeper screens, more clicks, less marketing copy.
The success metric is operational. Did the customer reach the activation milestone in week 1? Did they avoid the kickoff Zoom? Did they file fewer support tickets in week 2 than the cohort average?
The build pattern that works: take the welcome email and replace the "watch this 30-minute video" link with an interactive walkthrough that opens cold and asks "what role are you in" as step 1. Branch into three variants based on the answer. Each variant lands on the activation milestone for that role.
For a product like SmartCue, role variants are roughly: PMM (capture flow → publish flow), sales (share-link flow → analytics view), CS (in-app placement → renewal-recap setup). For your product, the variants will be different but the structure is the same.
The CSM-deflection math is real. A 5-minute interactive walkthrough that gets 60% of new customers to activation without a kickoff call can save a CSM team dozens of hours a month. That math is what justifies extending the artifact-1 budget into artifact 2.

Building artifact 3: in-product feature-launch guides
Artifact 3 is the smallest in scope and the most consistently neglected. Every product ships features. Most products tell users about new features in two ways: a release-notes blog post (which nobody reads) and an in-app tooltip pointing at a button (which is dismissed as noise).
Neither moves adoption. What moves adoption is a 90-second interactive walkthrough that shows the user the feature in context with their data, triggered the first time they log in after launch.
The build pattern: when the feature ships, capture a 6-8 step walkthrough using the same Chrome-extension flow as artifact 1. Edit it for in-product context (no marketing copy, no CTA to "book a demo," just "here's the feature, here's what it does, here's where it lives"). Embed it via the in-app SDK or via a banner in the customer portal that links out to the walkthrough URL.
Trigger rules: show on first login post-launch, dismissable, never shown twice to the same user, tracked at the user level so product can measure 30-day adoption.
The teams that do this well — Personify Health, Creditsafe, OneDigital, League — treat feature-launch walkthroughs as part of the feature-ship checklist, not as a marketing afterthought. The walkthrough goes live the same day the feature does. PMM owns the marketing-page version; product owns the in-app version. Same source flow, different surface.
Building artifact 4: renewal-stage value-recap walkthroughs
Artifact 4 is the strangest and most powerful of the four. Almost nobody builds it. The teams that do see retention numbers other teams cannot match.
The job is to remind the customer what they got out of your product over the last twelve months, using their own data, before the renewal conversation starts. The audience is the economic buyer — the person who signed the contract, who probably hasn't logged in this quarter, who has the renewal request sitting in their inbox.
The build pattern is different from the other three artifacts. You are not capturing a generic flow. You are personalizing a recap with the customer's actual usage data: their seat count, their volume, their feature usage, their outcomes. Some of this is templated. Some of this is per-customer.
Structure that works:
- Hook — "Here's what your team did with us this year."
- Volume — actual numbers. "Your team published 47 demos. Viewers spent 230 hours engaged."
- Outcomes — tied to their pipeline. "Your demo-to-meeting rate improved from X% to Y% over the year."
- Adoption breadth — show which teams are using the product. Marketing, sales, CS, product. Multi-team usage is the strongest renewal signal.
- What's coming — features they haven't touched yet, including artifact-3 walkthroughs to onboard them on those features.
- Renewal CTA — book the renewal conversation, attach a multi-year quote.
This is the artifact that turns "we'll discuss it" into "let's just renew." It works because the customer's economic buyer rarely sees the product day-to-day. The recap puts the value back in front of them at the moment of decision.
Customer marquee
The teams shipping across all four artifacts include Personify Health (formerly Virgin Pulse), the global digital health platform with around 3,000 employees, who have published 800+ interactive demos and run well over 100,000 viewer interactions across pre-purchase, onboarding, and feature-launch surfaces. Creditsafe, the global credit-data business with 1,500+ employees across the UK, Italy, France, Germany, the Netherlands, and Belgium, runs 1,000+ demos with 30,000+ viewer interactions in a regional federation model. OneDigital, the US benefits-services firm with 3,000+ employees, runs 250+ active demos in a sales-led model where AEs personalize standard templates for outbound. League, Quisitive, and Dario Health run variants of the same operating model at different scales.
The pattern across all of them is that interactive product experience is not "the marketing demo." It is the connective tissue across pre-purchase, onboarding, in-product education, and renewal.

Operating model — who owns each artifact
The biggest organizational mistake is letting all four artifacts live with marketing. Marketing doesn't have visibility into onboarding outcomes, in-product adoption metrics, or renewal data. Letting marketing own all four means three of the four under-perform.
The operating model that works:
- Artifact 1 (pre-purchase) — owned by PMM or demand-gen marketing. Measured against website conversion and demo-to-trial rate.
- Artifact 2 (onboarding) — owned by customer success, with PMM as the capture-and-edit partner. Measured against time-to-first-value and CSM-hour deflection.
- Artifact 3 (in-product feature launches) — owned by product, with PMM as the marketing-side partner. Measured against 30-day feature adoption among MAU.
- Artifact 4 (renewal recaps) — owned by account management or CS, with data engineering as the per-customer-data partner. Measured against gross retention and net dollar retention.
One platform underneath all four. Same capture mechanic, same edit pattern, same publish-and-share flow. Different surfaces, different audiences, different metrics, different owners.
For HubSpot users, lead-capture data from artifact 1 syncs into HubSpot directly so the contact records are unified. Other CRM integrations are not supported; the data export from the platform's dashboard handles those cases. Plus any platform that supports HTML embed for distribution — that covers the surfaces that don't live in the CRM (in-app, customer portal, QBR decks, renewal emails).
The platform should run on production-grade cloud infrastructure with TLS 1.2+ encryption in transit and AES-256 encryption at rest. The full security posture lives at /security. For interactive-product-experience work, the load is heavier than a typical demo tool because artifact 4 personalization touches per-customer data; verify the security model against your procurement bar before deploying across all four artifacts.
Frequently asked about interactive product experiences
What's the difference between an interactive product experience and an interactive demo?
Interactive demo is one of the four artifacts that make up an interactive product experience. The demo is the pre-purchase artifact. The experience is the full lifecycle: pre-purchase, onboarding, in-product, renewal.
Do I need four separate tools to build the four artifacts?
No. One platform should handle all four. The capture and edit mechanic is the same; the surfaces and metrics are different. If a vendor only supports artifact 1, that is a sign the vendor was built for marketing and never extended to the rest of the lifecycle.
Where should we start if we only have artifact 1 today?
Artifact 2. Onboarding walkthroughs have the fastest payback because they directly deflect CSM hours. The math is easy to defend in a budget review. Artifact 3 and artifact 4 come after.
How long does it take to build all four artifacts for a single product?
About a quarter of focused work if one team owns the rollout. Two to three weeks per artifact in sequence, with the platform investment amortized across all four.
Who owns interactive product experience as a function?
Nobody by default. The most successful teams put it under the GTM lead in year one and split ownership across PMM, CS, product, and account management in year two. The connective tissue stays at the GTM-lead level for strategic alignment.
What's the right success metric for the program overall?
Net dollar retention. Pre-purchase artifacts move new logo revenue, but the other three move retention and expansion. The program-level metric should be the one that captures all four contributions.
Can I personalize interactive product experiences per viewer?
Yes for artifacts 1 and 2 — persona variants and role-based branching are the standard pattern. For artifact 4, personalization gets deeper because it includes the customer's own usage data, which means the renewal recap is per-customer, not per-persona.
How often should each artifact be refreshed?
Artifact 1 quarterly, tied to the marketing-page refresh cycle. Artifact 2 whenever onboarding flows change in the product. Artifact 3 on every feature launch. Artifact 4 quarterly, before each QBR cycle. Stale interactive content is worse than no interactive content.
Related reading
- What Is an Interactive Demo? — the architecture of artifact 1
- How to Create an Interactive Product Demo — the build instructions
- Demo Automation Playbook — the 90-day team rollout
- 12 Interactive Product Demo Examples — finished examples by funnel stage
- What Is SmartCue? — the platform behind all four artifacts
Build all four artifacts on one platform — sign up free at app.getsmartcue.com. Or see pricing →.