Fast SaaS Financial Model Template – Save 5X the Time

Building a SaaS company from the ground up? Whether you’re pitching to investors, onboarding new clients, or just trying to get your head around CAC payback periods and ARR, a bulletproof financial model is your best friend. But let’s be honest—creating one from scratch in Microsoft Excel can feel overwhelming, especially the first time around.
This is where a robust SaaS financial model template comes in. Designed specifically for SaaS startups, this downloadable spreadsheet helps you map out everything from subscription revenue, annual plans, and free trials, to acquisition channels, email campaigns, and headcount planning. It goes beyond a basic income statement—you’ll model key drivers, optimise operational efficiency, and forecast critical SaaS metrics like ARR, churn, and customer support costs.
Whether you’re launching a new version of your SaaS solution or refining your business plan to attract funding, this guide walks you through the best way to use our template for precise financial projections. From Twitter feedback to investor decks, it’s the kind of model that speaks startup and scales with you.
How To Map Out Your SaaS Metric in 8 Steps?
Building a SaaS financial model can feel like assembling a jet engine while flying—especially if you're a founder juggling product, growth, and team. But here’s the good news: You don't have to start from scratch with a structured SaaS financial model template in Google Sheets or Excel. These templates simplify your financial planning, helping you translate messy data into clean, actionable insights.
Let’s break down each template component so you can build more ingenious financial projections, track key SaaS metrics, and align your growth model with reality.
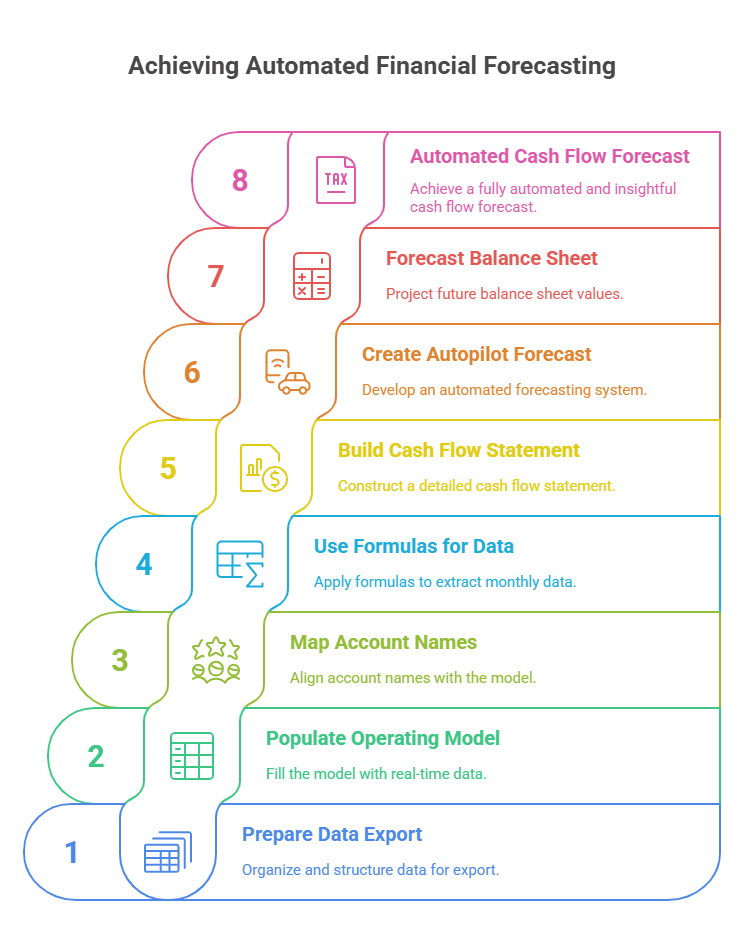
1. Prepare Data Export Tabs
You need clean data inputs before you forecast your next ARR (Annual Recurring Revenue) milestone or fine-tune your CAC (Customer Acquisition Cost) payback period. Creating dedicated data export tabs is the first step in any solid SaaS financial model template. These tabs pull raw data from tools like QuickBooks Online, Stripe, or your analytics platform. You never edit these manually—they serve as the single source of truth for everything from income statements to cash flow.
Example: For a startup like “Southeast Inc.”, export and organise your P&L, Balance Sheet, and Cash Flow reports from your accounting software into separate tabs.
2. Populate the Operating Model with Actuals
With data exports in place, the next step is to import those numbers into your operating model using formulas and Named Ranges. Start with Profit and Loss, then link your Balance Sheet and Cash Flow Statement.
This creates dynamic connections between your raw financial data and the metrics that drive your business. Monthly updates become quick and consistent, allowing your forecasts to evolve in real time—no version chaos, no outdated files.
Pro tip: Maintain naming consistency across sheets. It’ll save hours when updating data each month.
3. Map Account Names to the Model
Now comes the foundational setup: mapping your P&L, Balance Sheet, and Cash Flow account names into the model. Think of this as establishing the DNA of your SaaS financial model. Yes, it’s a bit tedious, but you only need to do it once—unless new accounts are added later.
Once mapped, the formulas in your model can start pulling subscription revenue, COGS, operating expenses, and more directly from the export tabs.
4. Use Formulas to Pull Monthly Data
With structure in place, let’s add the smarts. Each section of the model uses formulas to match account names and pull data into the correct periods—monthly, quarterly, or annually.
Example: A formula may match April 2020 (column AC) in your export and pull the corresponding “Net Income” or “Deferred Revenue.” Repeat the same approach for Balance Sheet and Cash Flow, adjusting the formula prefix to BS instead of P&L where needed.
Tip: Ensure your date columns in export and model sheets are always in sync. Misaligned columns can break your entire flow.
5. Build the Cash Flow Statement
Once your Balance Sheet is complete, the next step is to derive your Cash Flow Statement using the indirect method, calculating cash movements based on changes in assets and liabilities.
Increase in Assets = Decrease in Cash
Increase in Liabilities = Increase in Cash
This step gives your model a real sense of operational reality—capturing capital expenditures, debt inflows, or SaaS-specific items like deferred billing.
Why it matters: Cash flow clarity helps plan for funding needs, customer prepayments, and capital runway.
6. Create Your First “Autopilot” Forecast
After establishing historical actuals, it’s time to shift gears into forecast mode. Start with an "Autopilot" forecast—a 3-month average for each line item.
This isn’t your final model, but it creates a baseline forecast to iterate. For example, Cost of Revenue can be calculated as a percentage of projected subscription revenue, offering a realistic view of operational scalability.
The forecast pulls from a dedicated Autopilot Input column—override only where necessary.
7. Forecast the Balance Sheet
Forecasting the Balance Sheet doesn’t need to be overly complex, at least not initially. Use the last actual month as the base, and adjust for key drivers like accounts receivable, cash equivalents, and deferred revenue.
This keeps your model lean and functional while giving you enough clarity to inform hiring, marketing investments, or upcoming feature rollouts.
8. Cash Flow Forecast—Automated and Insightful
Unlike P&L and Balance Sheets, the Cash Flow Statement in this SaaS model doesn’t need manual forecasting. The calculations are automatic, linking net income, working capital changes, and financing flows to forecast net cash changes.
Your job? Just make sure those formulas extend across all future months.
What Makes a Great Financial Model for SaaS Startups?
Nailing your SaaS financial model isn’t just about impressing investors—it’s your blueprint for sustainable growth. From predicting churn to planning your runway, a solid model gives you clarity, confidence, and control. In this section, we’ll break down the key elements that turn a good SaaS model into a great one.
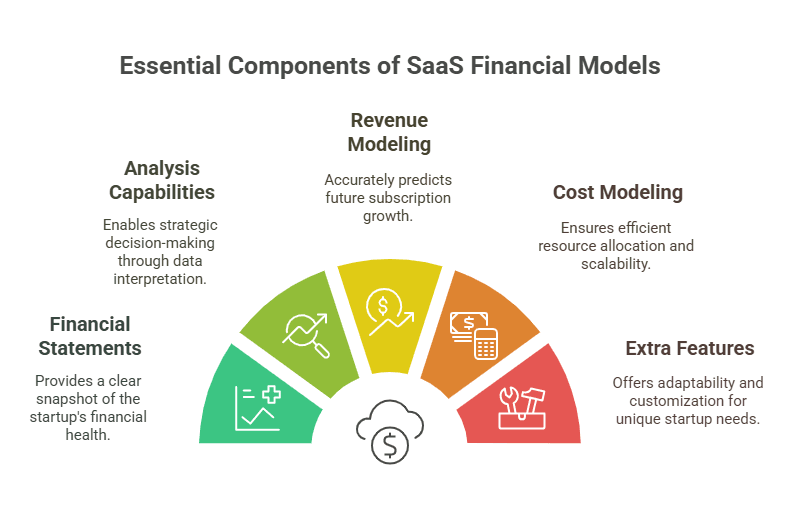
1. Financial Statements: The Backbone of the Model
At the core of any reliable SaaS financial model template are the three essential financial statements:
Profit & Loss Statement – Breaks down subscription revenue, costs of goods sold, and operational expenses to highlight profitability and EBITDA trends.
Balance Sheet – Offers a snapshot of your startup’s financial position, tracking assets, liabilities, and equity over time.
Cash Flow Statement – Maps the cash movement in and out of your business, allowing you to monitor runway and liquidity.
These financial statements reflect the business's current health and serve as the foundation for forward-looking models, funding plans, and boardroom decisions.
2. Analysis Capabilities: Turning Numbers into Strategy
A great SaaS financial model template doesn’t just show historical data—it helps you interpret what’s happening and predict what’s next. Built-in analytical features enable startups to convert raw numbers into actionable strategy.
Key analysis capabilities to look for include:
Scenario planning – Model different business outcomes based on changes in growth rate, churn, pricing strategy, or funding.
Sensitivity analysis – Test how small changes in a single metric (e.g., CAC or churn rate) impact revenue, cash flow, or runway.
Variance analysis – Compare actual performance against forecasts to identify what’s driving over- or under-performance.
“What-if” simulations – Evaluate the financial impact of decisions such as launching a new pricing tier, hiring, or entering a new acquisition channel.
Trend analysis dashboards – Track how key metrics like MRR, net revenue retention, and customer lifetime value evolve over time.
These capabilities make your SaaS financial model a living document—one that evolves with the business and builds trust with investors by showing a clear command of financial planning.
3. Revenue Modeling: Forecasting Subscription Growth with Precision
SaaS businesses live and die by recurring revenue. That’s why revenue modeling is a critical part of any SaaS financial model. A great template allows you to break down revenue by cohort, pricing tier, and customer lifecycle stage.
Key components include:
Monthly Recurring Revenue (MRR) breakdowns—new, expansion, and churned
Annual Recurring Revenue (ARR) forecasting
Upsell and cross-sell tracking
Customer churn and acquisition rate modeling
Conversion funnels from free trial to paid plans
With these inputs, your financial plan becomes a tool for growth, helping you pinpoint what's working, what isn’t, and where to double down.
4. Cost Modeling: Understanding Efficiency and Scalability
Operational efficiency is just as important as top-line growth. An effective SaaS financial model template includes detailed cost modeling to track how expenses scale with growth.
This includes:
Direct costs (COGS, hosting, software licenses)
Departmental costs (Sales, Marketing, R&D, G&A)
Headcount planning and payroll forecasting
Non-operating costs like interest, taxes, and depreciation
The model helps you optimise spending and evaluate profitability drivers like the LTV: CAC ratio by mapping out how costs evolve relative to user engagement, revenue, and hiring.
5. Extra Features: Flexibility That Adapts to Your Startup
While the core model focuses on revenue, cost, and financial statements, great SaaS financial models also include flexible features that allow for advanced planning.
Examples include:
LTV:CAC ratio tracking
Forecasting scenarios (e.g. aggressive vs conservative growth)
Custom metrics like net dollar retention, lead-to-customer conversion rates
CAC payback period calculators
Subscription cohort analysis and churn curves
These optional elements add depth to your forecasting and provide the agility needed to support pivots, pricing model changes, or market expansion. For startups preparing for funding rounds, they also enable clearer storytelling around traction and scalability.
Which Metrics Matter Most in a SaaS Financial Model—and Why?
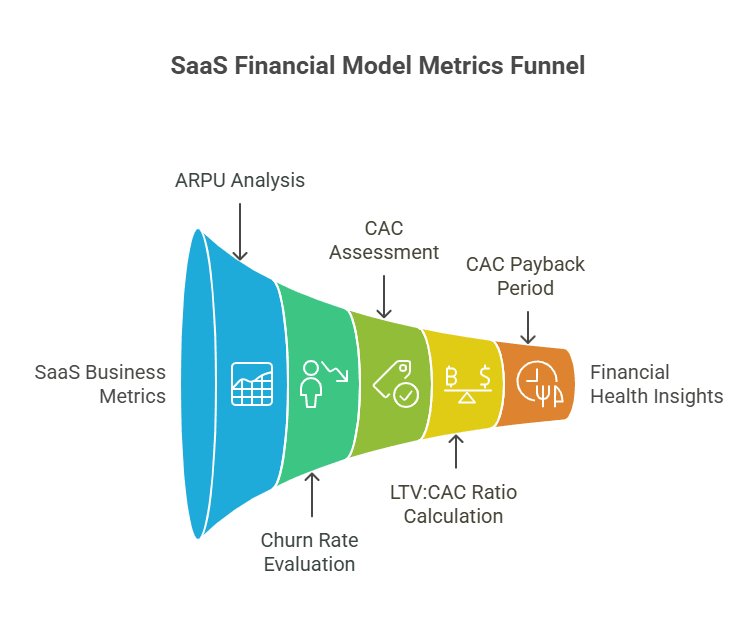
The effectiveness of any SaaS financial model template hinges on tracking the right metrics. These KPIs aren’t just numbers—they’re vital signals that help you forecast growth, assess efficiency, and steer decision-making. Here are five core metrics every startup SaaS model should include:
1. Average Revenue Per User (ARPU)
ARPU measures how much revenue you generate per active customer.
Formula: ARPU = Total MRR / Total active customers
Example: If your MRR is £50,000 and you have 1,000 customers, ARPU = £50.Rising ARPU suggests you're increasing value through upsells, pricing tiers, or customer stickiness.
Falling ARPU may indicate a shift toward lower-tier plans or smaller clients.
Use ARPU trends to refine pricing models and drive expansion revenue.
2. Churn Rate
Churn rate tracks the percentage of customers who cancel their subscriptions in a given time frame.
Formula: Churn Rate = (Customers lost during period / Total customers at start) × 100
Example: Lose 50 customers from a base of 1,000 = 5% churn.High churn erodes recurring revenue and signals retention issues.
SaaS financial models use churn to project future MRR decay and customer retention strategies.
Lower churn leads to better LTV and longer CAC payback periods.
3. Customer Acquisition Cost (CAC)
CAC calculates how much you spend to acquire each new customer.
Formula: CAC = Total acquisition spend / Number of new customers
Example: £10,000 marketing spend yields 200 customers → CAC = £50.A low CAC suggests marketing efficiency and product-market fit.
Track CAC over time to identify acquisition channel performance.
Compare CAC against ARPU and LTV to ensure sustainable growth.
4. LTV:CAC Ratio
This ratio compares customer lifetime value to acquisition cost, essential for SaaS unit economics.
Formula:
LTV = ARPU × Gross Margin × Customer Lifetime
LTV:CAC = LTV / CAC
Example: If LTV = £1,000 and CAC = £250, then LTV:CAC = 4:1.
Aim for a ratio of 3:1 or higher to maintain healthy margins.
Low ratios mean you’re either overpaying to acquire or under-monetizing your users.
Use this metric to align marketing spend with retention strategies.
5. CAC Payback Period
This measures how long it takes to recover the cost of acquiring a customer.
Formula: CAC Payback = CAC / Monthly gross margin contribution per customer
Example: If CAC is £200 and gross margin per customer per month is £50, → Payback = 4 months.Shorter payback = quicker ROI and more efficient scaling.
SaaS investors often prefer models with payback under 12 months.
Critical for cash flow management and capital-efficient growth planning.
Which SaaS Financial Model Templates Should You Use to Plan, Forecast, and Grow?
A well-structured SaaS financial model template isn’t one-size-fits-all. Different templates serve different functions—from forecasting revenue to allocating budgets—giving SaaS startups the tools they need to plan strategically and scale efficiently.
Here are 3 essential financial model templates to include in your toolkit:
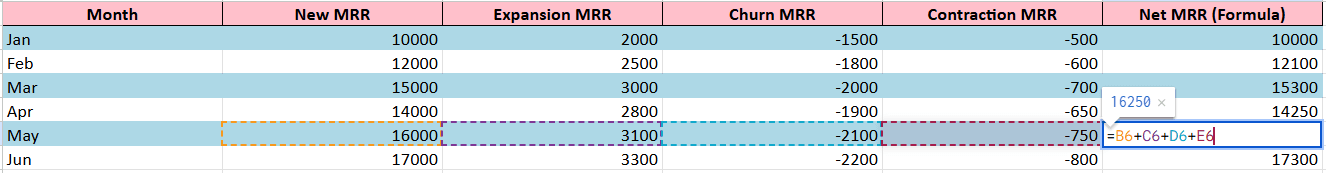
1. Revenue Planning Template
Purpose:
Accurately forecast your MRR by tracking the core components that drive revenue growth—or loss.
What's Inside
New MRR – Revenue from new customers
Expansion MRR – Upsells and add-ons
Churn MRR – Lost revenue from cancellations
Contraction MRR – Downgrades or reduced usage
Inputs You Control
Historical MRR by segment
ARPA (Average Revenue Per Account)
Growth, churn, expansion, and contraction rates
All values are editable, and formulas auto-adjust for scenario planning.
What You Get
MRR Waterfall Chart
Revenue Forecasts month-over-month
Sensitivity Analysis to test different churn/growth assumptions
Tip:
“Track your revenue drivers and simulate pricing or churn impacts—all in one Excel-native file.”
2. Sales Projection Template
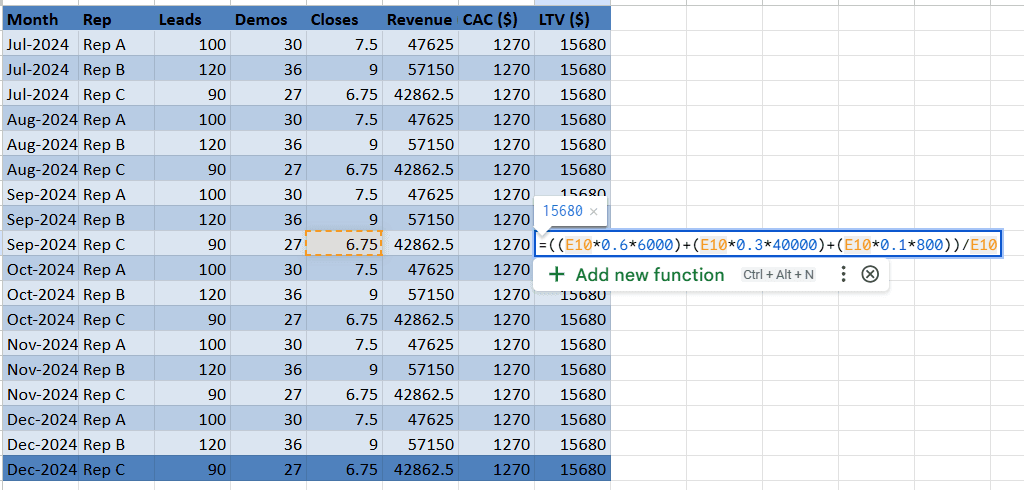
Purpose:
Forecast revenue more accurately by aligning your sales pipeline with funnel performance and rep capacity.
What’s Inside
Funnel Assumptions
Lead-to-Demo Rate
Demo-to-Close Rate
Built-in formulas simulate sales velocity through each stage.
Rep-Level Capacity
Monthly lead capacity per rep
Individual performance tracked automatically
Customer Segmentation
Revenue projections broken down by:
SMB
Enterprise
One-Time Buyers
Key Outputs
Quarterly Revenue Forecasts
Rep-Level Performance Snapshots
CAC vs. LTV Estimates (auto-calculated for each segment)
Pro Tip:
“Download our editable sales projection template and get a realistic picture of next quarter’s revenue pipeline—based on sales velocity, funnel stages, and lead quality.”
3. Top-Down Fund Budgeting Template
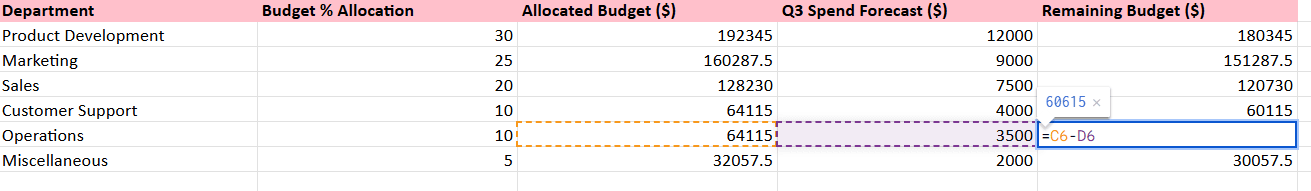
This model sets an overall budget limit from the top, then allocates funds across departments to stay aligned with strategic goals and cash constraints.
What's Included:
Inputs: Total budget, KPIs, and allocation rules by department.
Formulas:
Allocated Budget = Total Budget × Allocation %
Remaining Budget = Allocated Budget − Q3 Spend Forecast
Monthly Burn Rate = Total Q3 Forecast ÷ 3
Runway = Total Budget ÷ Monthly Burn Rate
Outputs:
Department-wise budget dashboard
Budget vs actual variance
Burn rate runway estimate
Prioritize spend where it matters most and give each team clarity with investor-aligned top-down planning.
Too Many Sales Demos, Not Enough Conversions? Try SmartCue
A great SaaS financial model template gives you clarity on how your startup is growing. But what if you could apply the same level of precision and insight to your sales demos and onboarding processes?
That’s where SmartCue comes in.
SmartCue helps SaaS startups scale sales faster by enabling personalized, no-code product walkthroughs that feel tailored, without engineering lift. Instead of relying on generic demos or juggling live calls, your team can create interactive, self-guided experiences that convert.
If your financial model is projecting growth, SmartCue ensures your sales funnel and onboarding are ready to handle it.
Ready to align your product storytelling with your revenue goals? Try SmartCue 14 Day Trial for Free today and close more deals—smarter and faster.
Conclusion
A well-built SaaS financial model template isn’t just a spreadsheet—it’s your startup’s command center for growth. From forecasting ARR and managing CAC payback periods to optimizing subscription revenue and aligning your business plan with reality, the right model helps you make smarter, faster decisions.
By combining data-driven structure with adaptable templates for revenue planning, sales projections, and cost modeling, you gain clarity, confidence, and control over your financial future. Whether you're gearing up for your first funding round or scaling your SaaS solution to new markets, this financial model will grow with you every step of the way.
Frequently Asked Questions
What is the most important metric for a SaaS startup?
While many metrics are noteworthy, Monthly Recurring Revenue (MRR) remains a critical metric for SaaS startups. It provides insight into consistent revenue, helping in efficient cash flow management and forecasting future growth.
How often should financial models be updated?
Financial models should be updated regularly, preferably on a monthly basis. Regular updates ensure the model reflects the actual business situation, enabling more accurate planning and decision-making.
Can this financial model scale with my business?
Absolutely! The beauty of a well-crafted SaaS financial model lies in its versatility. It's designed to accommodate changes in your business, following your trajectory from an early-stage startup to a full-fledged enterprise.
What are the first steps to take when creating a financial model?
The first step in creating a financial model is gathering all relevant data. Then, define your revenue streams, build your expense categories, develop assumptions, construct your financial statements, validate and adjust them as necessary, perform sensitivity analysis, and continue to update and monitor.
What is a SaaS financial model template used for?
A SaaS financial model template is used to forecast revenue, track key SaaS metrics such as ARR and churn, manage expenses, and plan for future growth. It provides a structured approach to understanding your startup’s financial performance and making informed decisions, especially when preparing for fundraising or scaling operations.
Can I customize the SaaS financial model template for my business?
Absolutely. A well-designed SaaS financial model template should be flexible enough to adapt to your pricing model, acquisition channels, team structure, and revenue streams. Whether you're offering free trials, annual plans, or usage-based pricing, the template can be tailored to reflect your specific SaaS business model.
Comments
Your comment has been submitted