By Robin Singhvi · Founder, SmartCue · Updated April 29, 2026
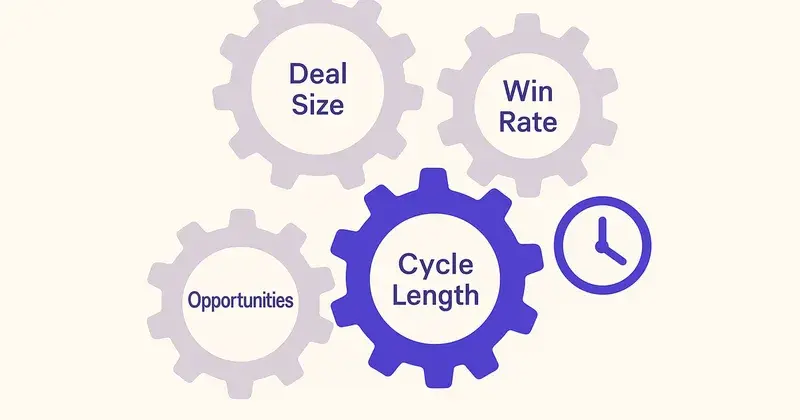
Every B2B sales leader can recite the formula in their sleep:
Sales Velocity = (Number of Opportunities × Average Deal Size × Win Rate) ÷ Sales Cycle Length.
It's the cleanest single number in B2B revenue math. Four inputs, one output, dollars per day. If your sales velocity is $5,000 a day, your pipeline is generating $5,000 of revenue per day in expectation. Want $10,000? Move the inputs.
So far so good. The trap shows up in the next sentence of every sales-velocity article on the internet, which goes: "To increase sales velocity, optimize all four variables."
That sentence is wrong. I'd argue it's the single most common piece of bad advice in B2B sales operations.
Here's my defended thesis for this post: three of the four variables in the sales velocity formula are zero-sum tradeoffs against each other. You cannot move opportunities, deal size, and win rate independently — pulling one usually pushes another in the opposite direction. Only the fourth variable, sales cycle length, is genuinely improvable in isolation in 2026. And cycle length is the lever where interactive demos move the needle without giving anything back on the other three.
I've watched 4,000+ teams use SmartCue across PMM, sales, CS, and product orgs. The pattern is brutally consistent. Teams that try to optimize all four variables end up doing none of them well. Teams that focus the lever on cycle length — and treat the other three as constraints to be respected, not variables to be cranked — compound their numbers quietly and durably.
This post unpacks why. I'll walk through the four variables, show you which combinations cancel each other out, defend why cycle length is the one safe lever, and end with seven tactics that actually compress cycle length in 2026 without sacrificing the rest of the formula.
The four variables, broken down
Before I attack the standard advice, let me make sure we're working off the same definitions. The formula has four inputs:
Number of opportunities. How many qualified deals are in your pipeline at any given time. Driven by demand-gen, outbound, inbound, partner motion, and qualification rules. The "top of funnel" variable.
Average deal size. The mean (or median, depending on your reporting hygiene) revenue per closed-won opportunity. Driven by ICP fit, pricing tiers, expansion math, and segment mix. The "who you sell to" variable.
Win rate. The percentage of qualified opportunities that close-won. Driven by qualification quality, sales execution, product fit, competitive dynamics, and pricing posture. The "how well you sell" variable.
Sales cycle length. The average days from opportunity-created to closed-won. Driven by buyer-decision complexity, number of stakeholders, evaluation friction, and how fast your sales motion can answer questions. The "how fast you sell" variable.
Multiply the first three, divide by the fourth, and you get dollars-per-day. Move any of them in the right direction and velocity goes up. Sounds simple. It isn't.
Why three of four are zero-sum tradeoffs
Here's where the standard advice falls apart. Each of the first three variables is locked in tension with at least one of the others. You can't move them independently; the math punishes you.
Opportunities vs. win rate
The fastest way to add opportunities is to lower your qualification bar. Drop a few BANT criteria, accept slightly worse-fit leads, count more demos as "qualified." Your opportunity count goes up — and your win rate craters, because you're now selling to people who shouldn't have been in the pipeline in the first place.
Run it the other way. Tighten qualification, only count opportunities where the buyer has budget, authority, need, and timeline confirmed by an AE. Win rate goes up. Opportunities collapse, because you've pushed half the pipeline back into "marketing-qualified" status.
I've seen this in practice with mid-market SaaS teams who decide to "improve velocity" by loosening MQL→SQL handoff. Their opportunity count doubles in a quarter. Their win rate halves. Net velocity: unchanged. They spent three months solving for the wrong variable.
Deal size vs. opportunities
The fastest way to grow deal size is to move upmarket. Sell to enterprise instead of SMB, sell platform instead of product, package three modules together instead of one. Average deal size goes up.
Opportunity count goes down, because enterprise pipelines are narrower than SMB pipelines by an order of magnitude. There are fewer Fortune 500 prospects than there are 50-person startups, and they're harder to get to.
Conversely, the fastest way to grow opportunity count is to drop your minimum price point and chase the long tail. Self-serve $99/year tiers fill the funnel. They also crater your average deal size.
You cannot fix both at once. You pick a segment and you live with the segment's natural deal-size distribution.
Deal size vs. win rate
Bigger deals have lower win rates. Always. A $5,000 ACV deal might close 35% of the time at a SaaS company; a $500,000 ACV deal at the same company will close at 12%. The reasons are structural: more stakeholders, longer evaluations, more competitive scrutiny, more "no decision" outcomes.
If a sales leader tells you they're going to grow average deal size and keep win rate constant, they're either not measuring carefully or they're describing a year of luck rather than a strategy.
What this means for the formula
Three of the four levers are interlocked. You can move them — but you have to accept that moving one usually moves another in the wrong direction. The arithmetic-style advice ("just optimize all four") ignores how the variables actually behave in production.
A serious operator picks one of the three to anchor (usually deal size, because segment is a strategic decision), accepts the win-rate and opportunity-count consequences that fall out of that decision, and stops trying to "improve" them as if they were independent dials.
That leaves one variable. Sales cycle length.
Why cycle length is the safe lever
Cycle length is structurally different from the other three. Compressing it doesn't force a tradeoff against the others — and in many cases it improves them indirectly.
Consider what makes a sales cycle long:
- Buyers can't get answers fast enough about whether the product does what they need
- Buyers can't show the product to their stakeholders without scheduling more demos
- Buyers wait days between AE responses to product questions
- Procurement, security review, and legal each add weeks of dead time
- Multi-stakeholder evaluations require sequential meetings instead of parallel review
None of those frictions are doing anything good for your win rate, your deal size, or your opportunity count. They're pure drag. Removing the drag improves velocity directly (smaller denominator) without giving anything back on the numerator.
In fact, compressing cycle length usually helps the other variables:
- Win rate goes up when buyers get answers faster, because deals don't drift into "no decision" purgatory while a champion changes jobs
- Opportunity count goes up indirectly, because AEs working shorter cycles can carry more concurrent deals
- Deal size stays stable, because you're not changing what you sell or who you sell to — you're just removing waiting
This is why I treat cycle length as the only variable worth aggressively optimizing. It's the one input where "improve it" doesn't mean "trade it against something else."
The question is how. And this is where most sales-velocity articles go off the rails again, recommending tactics that don't actually compress cycle length, just feel like they should.
How interactive demos compress cycle length
Most cycle-length friction in 2026 traces back to one root cause: the buyer can't see the product working until an AE finds time to show them. Every demo is a calendared event. Every stakeholder needs their own version. Every product question that comes up between demos waits for the next call.
Interactive demos kill that constraint. The buyer self-serves the product walkthrough, on their own schedule, as many times as they need to. They forward it to their stakeholders. The stakeholders forward it to their stakeholders. Procurement gets a personalized walkthrough for the security review. Legal gets the data-handling overview. None of it requires an AE on a call.
The mechanics that compress cycle length:
Asynchronous evaluation. Instead of "Can we get a 30-minute demo next Tuesday?", the buyer clicks a link and sees the product in 6 minutes. Cycle math: 5 days saved per stakeholder.
Stakeholder forwarding. A typical B2B SaaS deal has 6-10 stakeholders by 2026 averages. Interactive demos forward via URL; live demos require re-scheduling. Cycle math: 2-3 weeks saved on multi-stakeholder rounds.
Procurement and security pre-answers. A focused interactive demo on the data-handling flow answers the security team's standard questions before they ask. Cycle math: 1-2 weeks saved on security review.
On-demand objection handling. Sales reps send variant demos that pre-answer the top 3 objections that came up in the last call. Cycle math: 2-4 days saved per objection cycle.
For SmartCue customers running this motion well, the median deal cycle compresses by 20-30% inside the first two quarters of rollout. Personify Health (formerly Virgin Pulse, ~3,000 employees, 800+ interactive demos in production) uses interactive demos as a default replacement for second-touch live demos in their enterprise motion. Creditsafe (1,500+ employees across UK / IT / FR / DE / NL / BE, 1,000+ demos) routes regional procurement reviews through interactive demos before any AE conversation happens.
In both cases, the other three variables held steady. Win rate didn't drop. Deal size didn't shrink. Opportunity count didn't change. Only cycle length moved — and it moved hard.
The 7 tactics that actually work in 2026
These are the seven I've seen compound across the SmartCue customer base. Each one is a cycle-length play. None of them require sacrificing deal size, win rate, or opportunity count. I'm reframing the legacy "7 tactics" structure of the original post around the cycle-length thesis, because that's the only frame that holds up under scrutiny.
Tactic 1 — Replace the second-touch live demo with an interactive demo
The first demo is usually live, conversational, and discovery-driven. Keep it. The second demo — where the AE re-walks the same flow for a different stakeholder — is the one that interactive demos should replace. AEs reclaim the calendar time; buyers get the walkthrough on their schedule. Median cycle saving: 5-7 days per second-stakeholder loop.
Tactic 2 — Build a "send before the call" interactive demo
Send a 6-minute interactive demo 24 hours before any first call. The buyer arrives already familiar with the product surface, which means the call is about their problem, not your interface. Discovery quality jumps; follow-up confusion drops. Median cycle saving: 1-2 follow-up calls eliminated.
Tactic 3 — Wire the demo into HubSpot lead sync
Demo engagement (steps completed, time-on-demo, CTA clicks) should land directly on the contact record in your CRM. SmartCue does this with HubSpot natively. AEs see who's actually evaluating the product before they reach out, instead of cold-calling MQLs who haven't engaged. Cycle saving: AEs prioritize the warm half of the pipeline, compressing time-to-meeting on the deals that actually move.
Tactic 4 — Build persona-variant demos, not one master demo
Most teams build one demo and send it to everyone. That demo is calibrated for the most common persona and lands flat with the others. Build 3-5 variants — VP of Marketing, Director of Sales Ops, RevOps lead, etc. — sharing the same capture base. Each stakeholder gets the version calibrated to their concerns. Cycle saving: 1-2 weeks on multi-stakeholder evaluations.
Tactic 5 — Embed an interactive demo on the website hero
Top-of-funnel demos compress the early evaluation cycle. Instead of "request a demo → wait 2 days for an AE → schedule for next week," buyers click and walk through the product in 6 minutes. The ones who self-qualify out save your AE time; the ones who self-qualify in arrive at the first call already convinced. Cycle saving: 5-10 days on the qualification-to-first-meeting leg.
Tactic 6 — Use interactive demos for security and procurement pre-answers
Build a focused 4-minute demo specifically for the data-handling, access-control, and audit-log flows. Send it to procurement and security teams the moment they enter the deal. Most security questionnaires answer themselves once the reviewer has seen the actual product behavior. SmartCue links to its /security page for the formal specifics — TLS 1.2+ encryption in transit, AES-256 at rest, granular per-org access controls, audit logs, IP allowlisting on demo viewing — running on production-grade cloud infrastructure. Cycle saving: 1-2 weeks on procurement review.
Tactic 7 — Make demo recency a tracked metric, not a vibe
The fastest way to lengthen cycles in year two is to let the demos go stale. Product UI changes; the screenshots don't. Buyers spot the discrepancy and trust drops, which forces extra confirmation calls. Track screenshot age on every shipped demo. Refresh anything older than 90 days. SmartCue surfaces this as a built-in metric. Cycle saving: prevents the slow regression that would otherwise erase the wins from tactics 1-6.

What this looks like at scale
These seven tactics compound when teams run them together. A snapshot from the SmartCue customer base:
Personify Health — global digital health platform — runs tactics 1, 2, 4, 5, and 7 across their PMM and sales orgs. Their interactive demo library has grown to 800+ active demos, with well over 100,000 viewer interactions logged. Cycle compression in the enterprise segment: meaningful enough that the program has its own line item in the GTM operating review.
Creditsafe — global credit-data platform — runs tactics 1, 3, 4, and 6 across a regional federation model. Each region operates the workflow on top of a shared capture base; 1,000+ demos in production with 30,000+ viewer interactions. Cycle compression on multi-stakeholder evaluations is the load-bearing win.
OneDigital — US benefits services, 3,000+ employees — runs tactics 1, 2, and 3 across a sales-led motion. AEs personalize 250+ active demos for individual outbound, with HubSpot lead sync wiring engagement back to the contact record. Cycle compression shows up as faster time-to-meeting on warm pipeline.
League, Quisitive, Dario Health — variants of the same operating pattern at different scales. Each anchors on cycle-length compression as the primary lever; none of them tried to optimize all four formula variables simultaneously.
The unifying signal: focus the lever, respect the other three variables as constraints, and the velocity number moves.

Frequently asked about sales velocity
What is the sales velocity formula?
Sales Velocity = (Number of Opportunities × Average Deal Size × Win Rate) ÷ Sales Cycle Length. The output is dollars per day. It tells you how much revenue your pipeline is generating in expectation, normalized for time.
Is sales velocity actually a useful metric?
Yes — as a direction indicator. It tells you whether your pipeline is accelerating or decelerating quarter-over-quarter. As an operating metric for prescriptive change, it's misleading because three of the four inputs are interlocked. Use it to detect drift; don't use it as a checklist of dials to crank.
Why can't I just optimize all four variables at once?
Because three of them — opportunities, deal size, and win rate — are zero-sum against each other. Loosening qualification adds opportunities and crashes win rate. Moving upmarket grows deal size and shrinks opportunity count. Bigger deals close at lower rates. Treat them as a strategic posture (segment + ICP), not as independent levers.
What's the most improvable variable?
Sales cycle length. It's the only one of the four where you can move it without giving something back on another variable — and in many cases compressing it actually improves the others indirectly.
How much can interactive demos actually compress my cycle?
In my experience across the SmartCue customer base, well-run programs see 20-30% cycle compression inside the first two quarters. Teams running tactics 1-7 together see more; teams running just one or two see less.
Do interactive demos hurt deal size or win rate?
No. The mechanism is removing friction, not changing what you sell or who you sell to. Customers running the seven tactics above hold deal size and win rate flat (or slightly improve them) while compressing cycle length.
What CRM does SmartCue integrate with?
HubSpot for lead sync — one CRM, done well, beats five integrated badly. Plus any platform that supports HTML embed for distribution.
How do I get started without a full 90-day rollout?
Pick tactic 1 or tactic 5 and ship one demo this week. The compounding starts as soon as one demo is in production. The seven-tactic motion is the destination; one demo on one channel is the entry point.
Related reading
- What Is SmartCue? — the platform behind the seven tactics
- What Is Demo Automation? — the workflow architecture that makes cycle compression operational
- Demo Automation Playbook — the 90-day rollout that operationalizes these tactics
- 12 Interactive Product Demo Examples — finished demos to model
- SmartCue alternatives compared — the platform-decision aid
Compress your sales cycle starting this week — sign up free at app.getsmartcue.com. Or see pricing →.